This page is showing some diagrams and resources I used and created for my analysis.
Elements of research for my analysis (things which relate with my theme and topic choice):
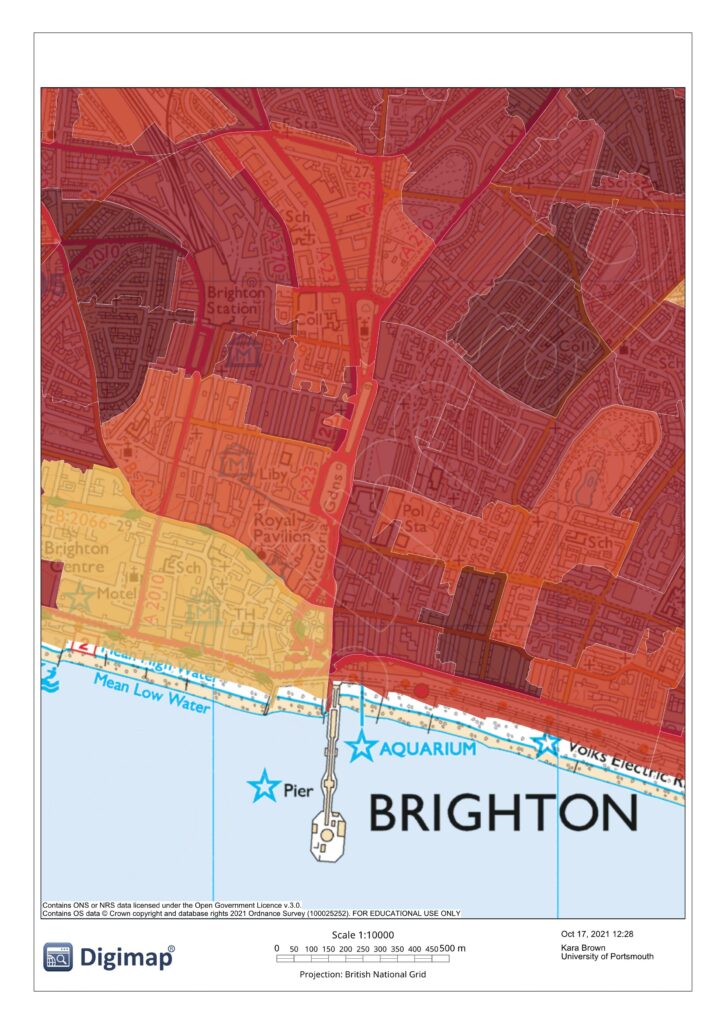
- Biodiversity – What is biodiversity and the factors contributing to it. Through this also showing green spaces within Brighton around Valley Gardens and how much of this is public and private space. (This will then help me indicate the amount of people who have gardens for for my pavilion is working)
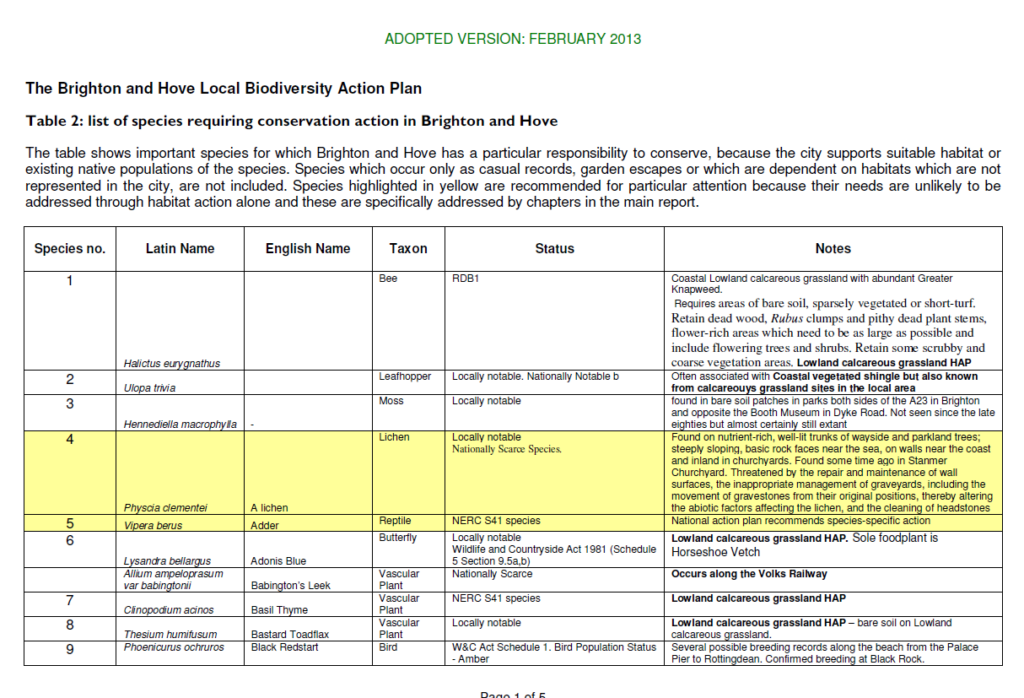
- Biodiversity in Valley Gardens – The species within Valley gardens and the specific biodiversity found within Brighton. Within this I will also look at the Valley Gardens scheme and many species that may be threatened in Brighton due to there not being the right habitats.
- Environmental Analysis – Analyzing the sun path over the area and other environmental aspects like the wind which may affect the placement on site.
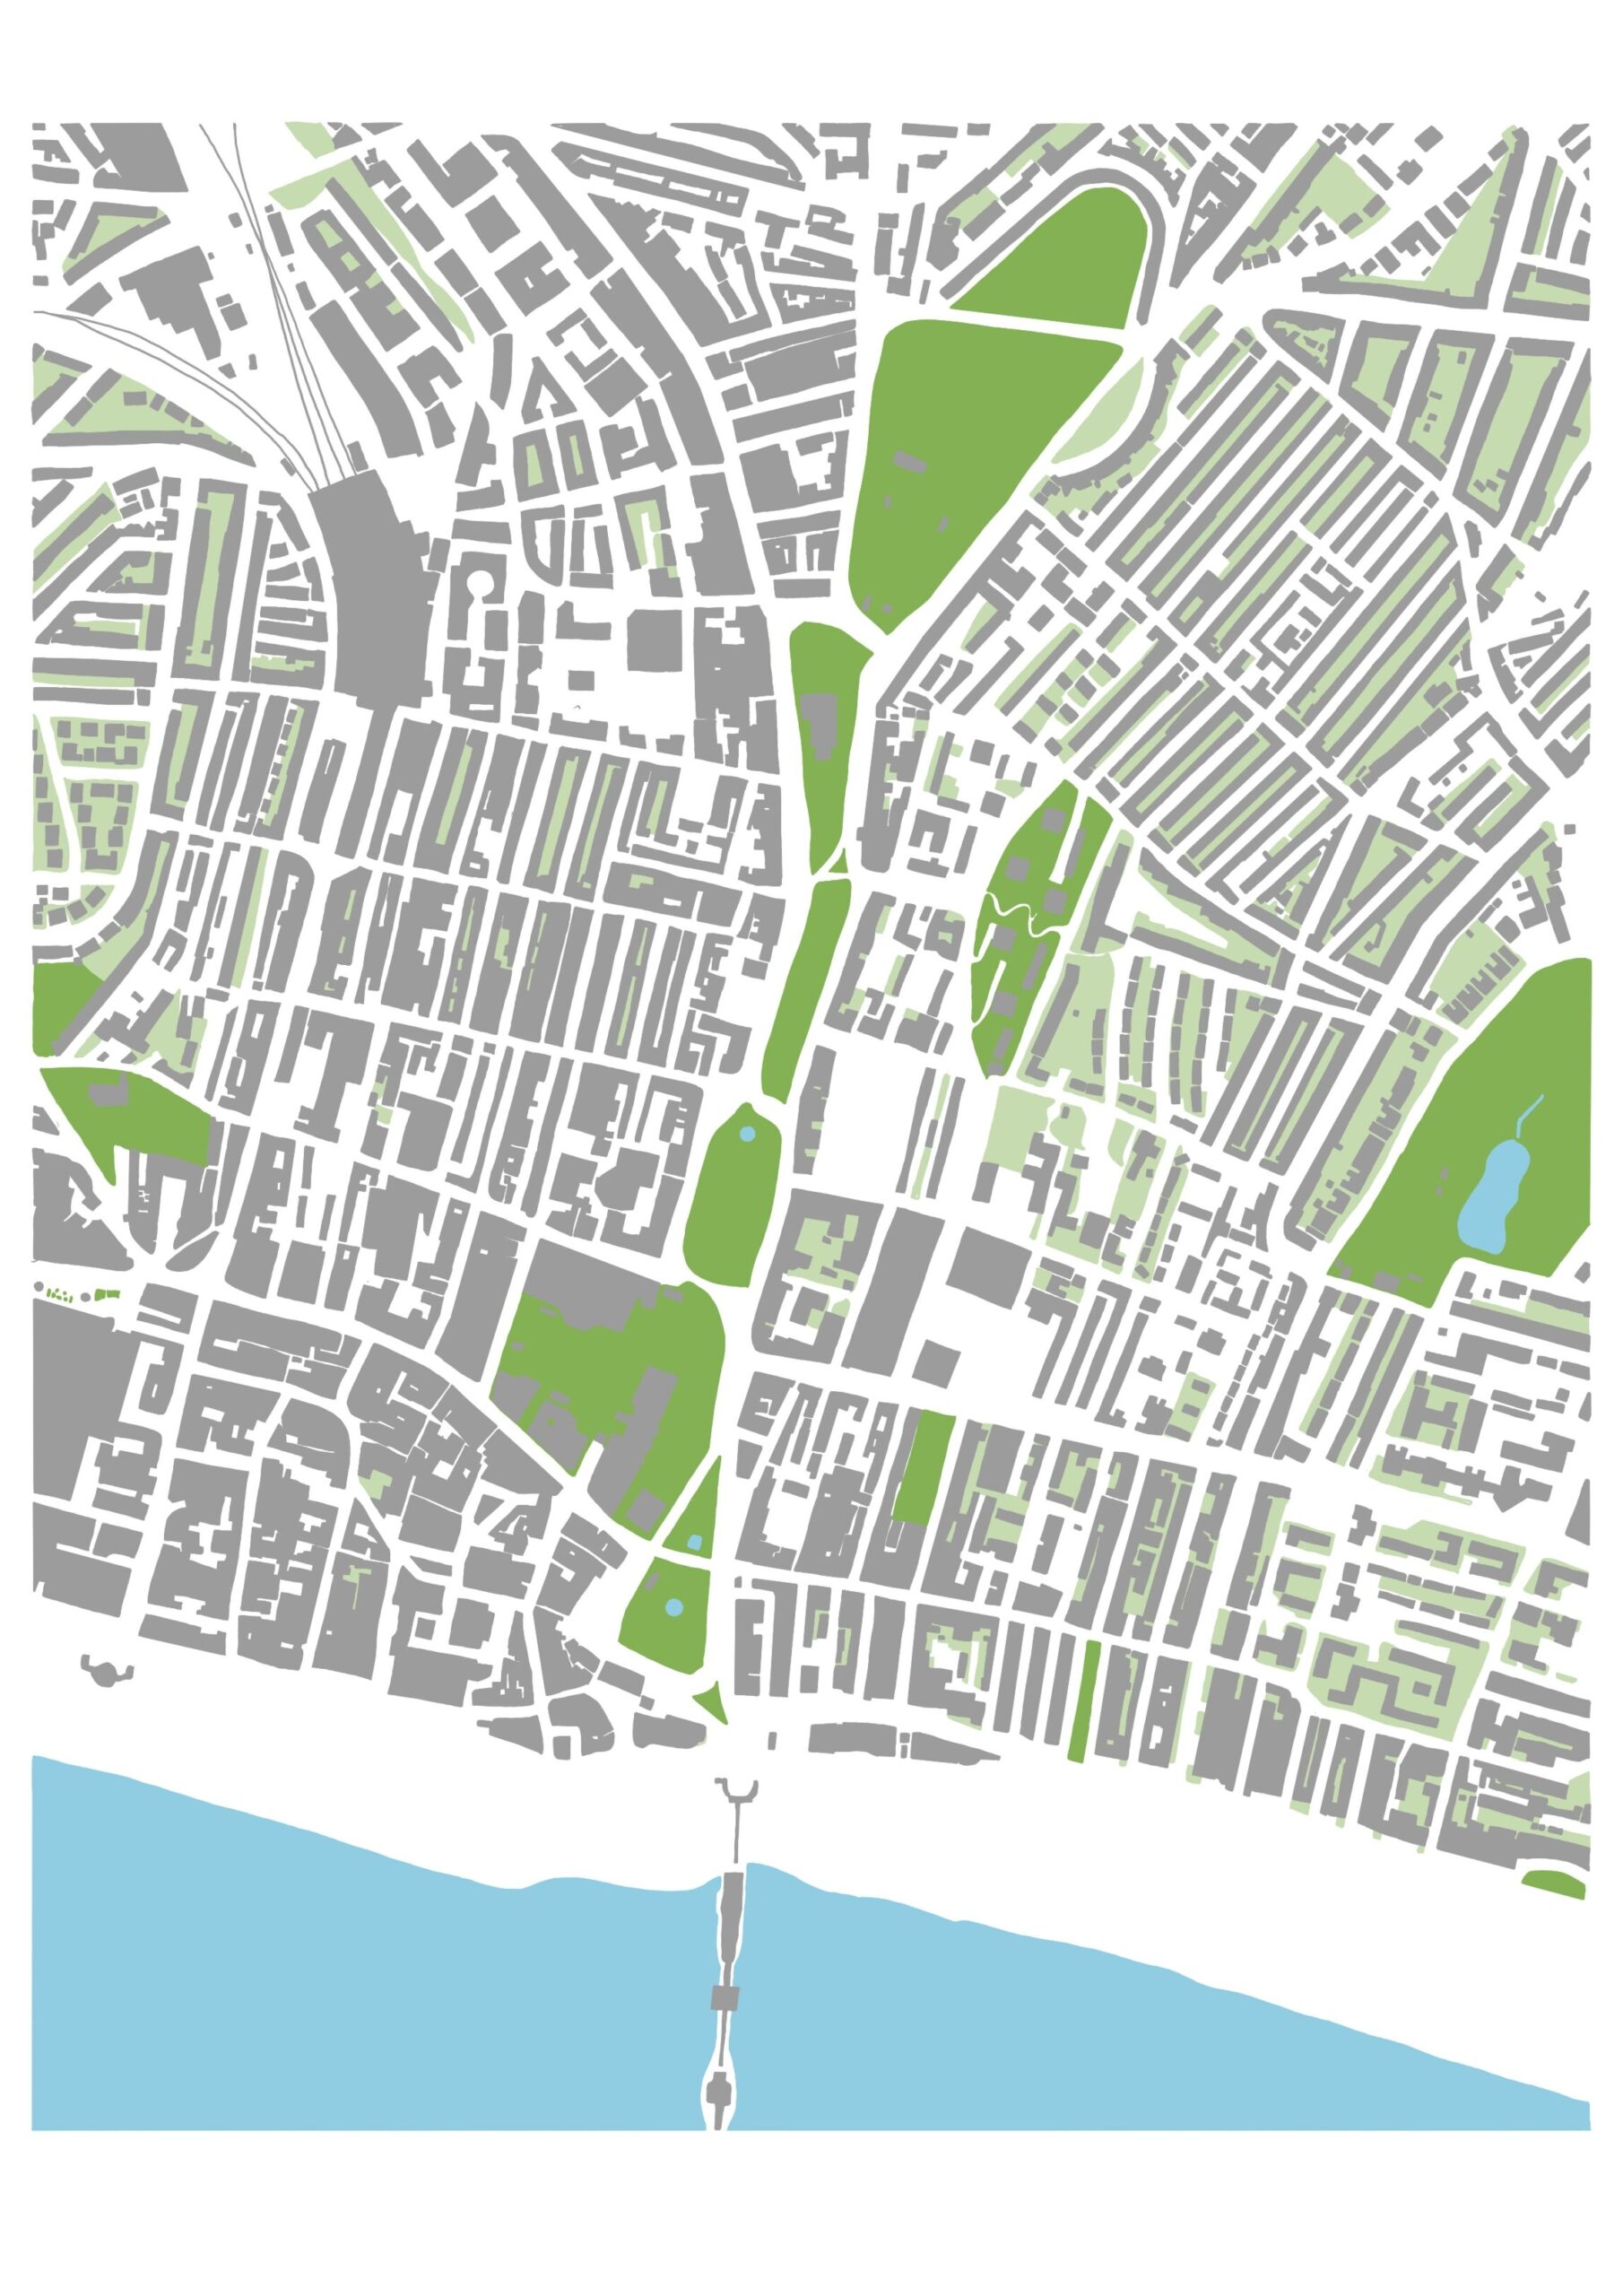
- History and Urban fabric development – some of the key history information of the site that is useful to me, as well as history of how the area has developed over time with figure ground studies.
- Pollution and Carbon emissions – researching data that shows how many carbon emissions there are in Brighton as well as the pollution levels and how this is effecting the biodiversity. (Many useful statistics)
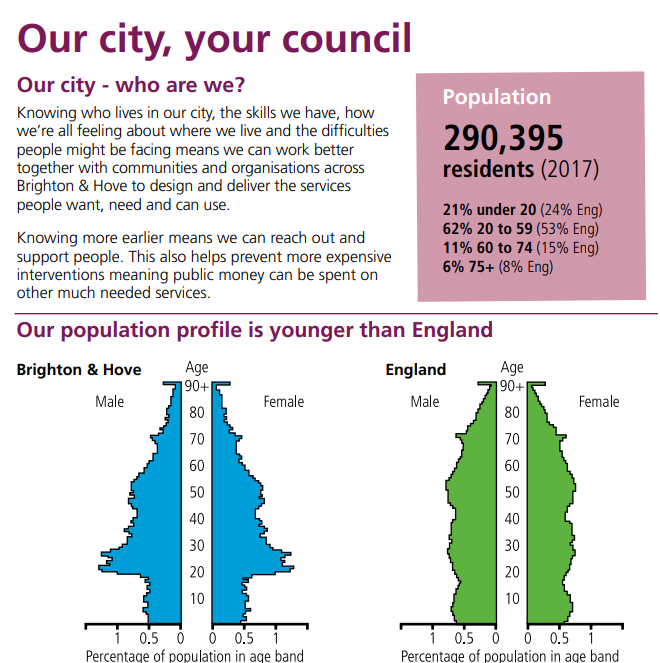
- Population density and age demographics – Showing how the area is populated and the mean age of the area to show how many people of what age are visiting Valley gardens area. This is also helpful in how the pavilion is set up as well as the relationship between pollution and population density.
BIODIVERSITY
For Biodiversity I found a lot of information on what biodiversity is and how we are contributing to the Biodiversity crisis. There are 5 main ways that we are contributing:
- Building up areas
- Pollution
- Over-exploitation
- Climate change
- Invasive species and disease
One thing i found shocking was how the UK was in the lowest 12% of countries with biodiversity intactness. This is a big issue as biodiversity is helping us live on the earth. In comparison to other countries in the world, the UK only has 50.3% of its biodiversity left, whereas, Canada has 89.3% left. You can see from these statistics that the UK needs action.

For the green map I wanted to show how the spaces in Valley Gardens is separated with its green spaces. From this I can see a big difference in how the more residential side of Brighton has many gardens which then has Valley gardens separating it from the commercial area which has less gardens. If I am able to bring education on biodiversity to the community many of these gardens could be brought to life with biodiversity bringing up Brighton’s biodiversity and thus, helping with many other factors.

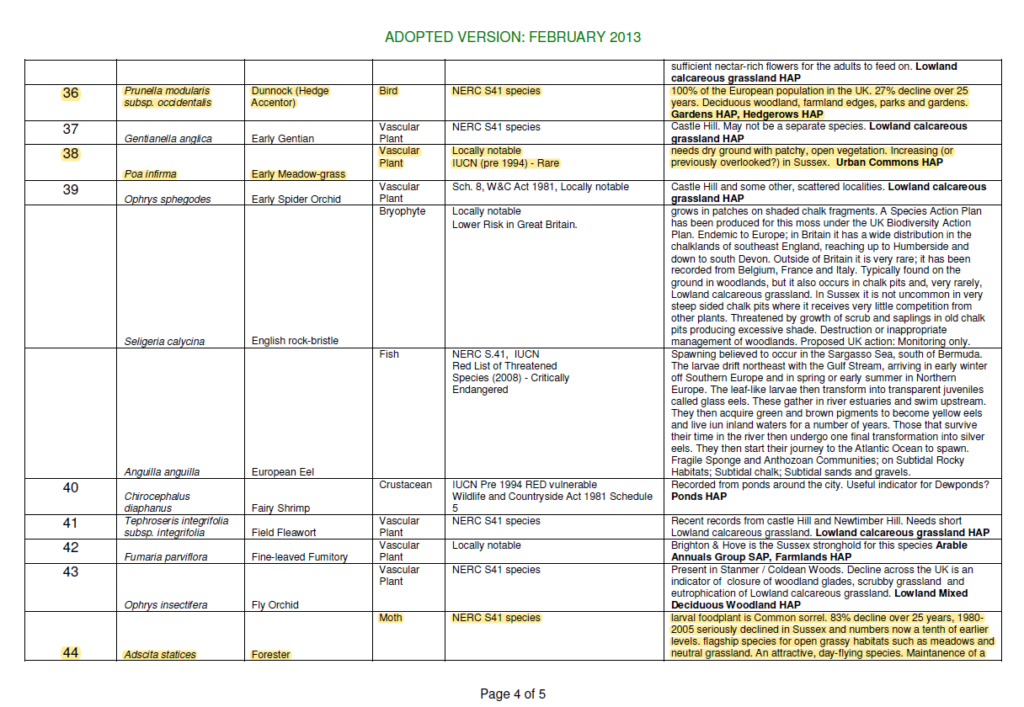
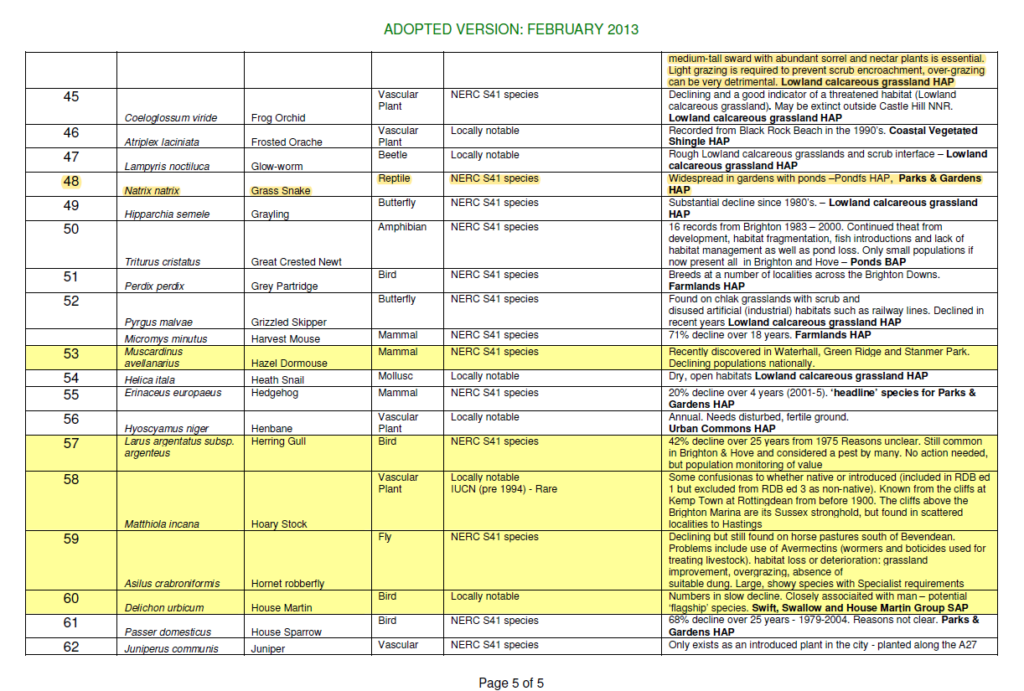
BIODIVERSITY IN VALLEY GARDENS
For finding the biodiversity of Valley Gardens and Brighton I used images which I took at the site and google lenses these. This helped a lot at the beginning of finding information. I then also used data found online which shows many species within Brighton. This data was really helpful as it was showing me many of the plants and animals but also how they are endangered or if they are lacking habitat to survive.


ENVIRONMENTAL ANALYSIS


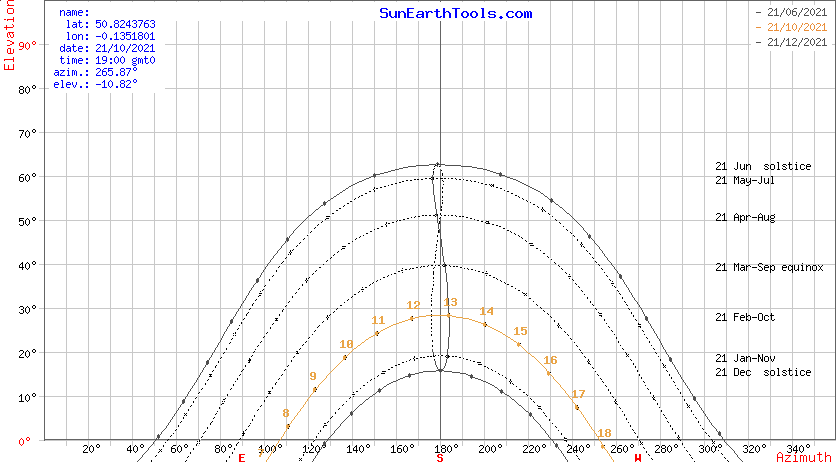
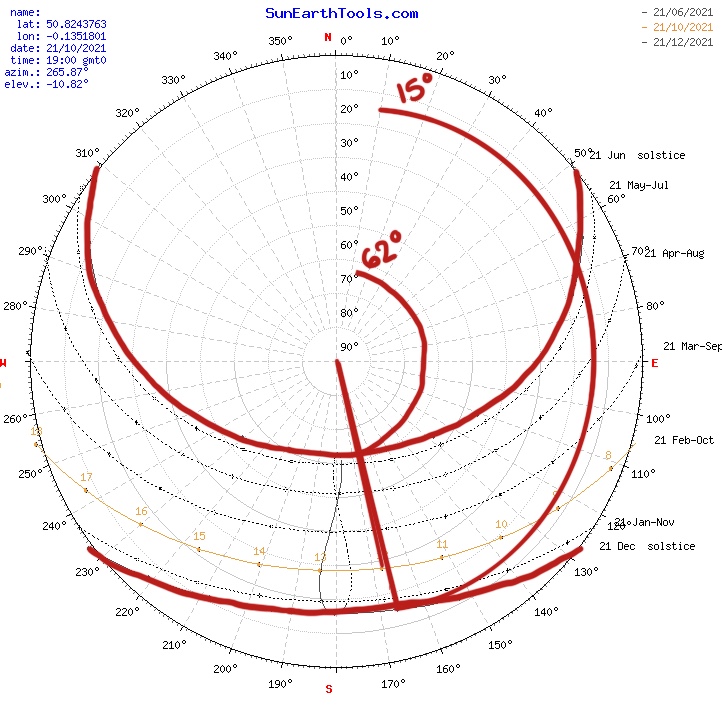
Here I drew over the sun path so that I could work out the angles of the sun within summer solstice and winter solstice. Doing it this way is helpful so that I could get an accurate reading and understand how the sun is moving over the site and my chosen area for the pavilion.
HISTORY AND URBAN FABRIC DEVELOPMENT
A lot of the information for the history of the site can be found under my post of the site.

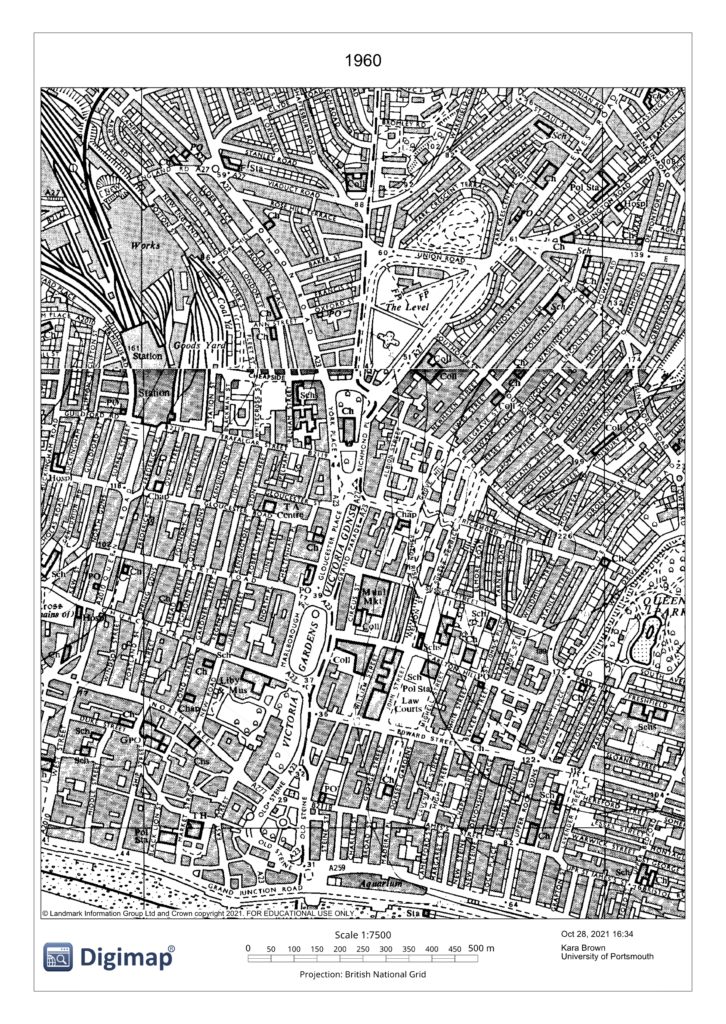

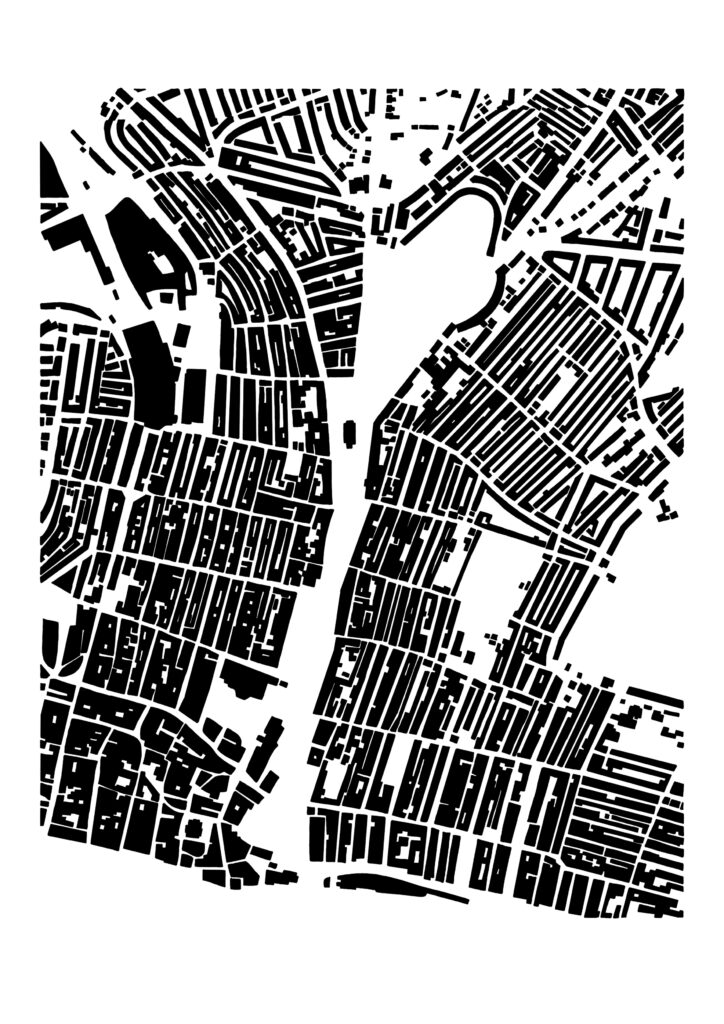


This data is very important in helping to understand how the City has changed over time with adding of buildings but also redevelopment of some areas. I find it interesting how you can see a change in the sizing of some of the roads as well as some areas becoming more open. This is something I want to further explore (especially the road changes over time and how this relates to pollution levels.
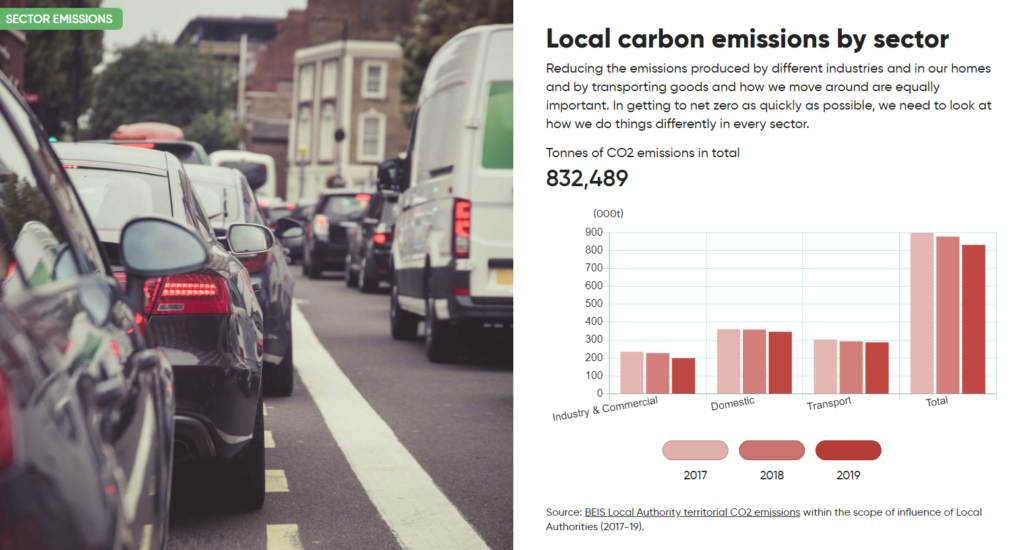
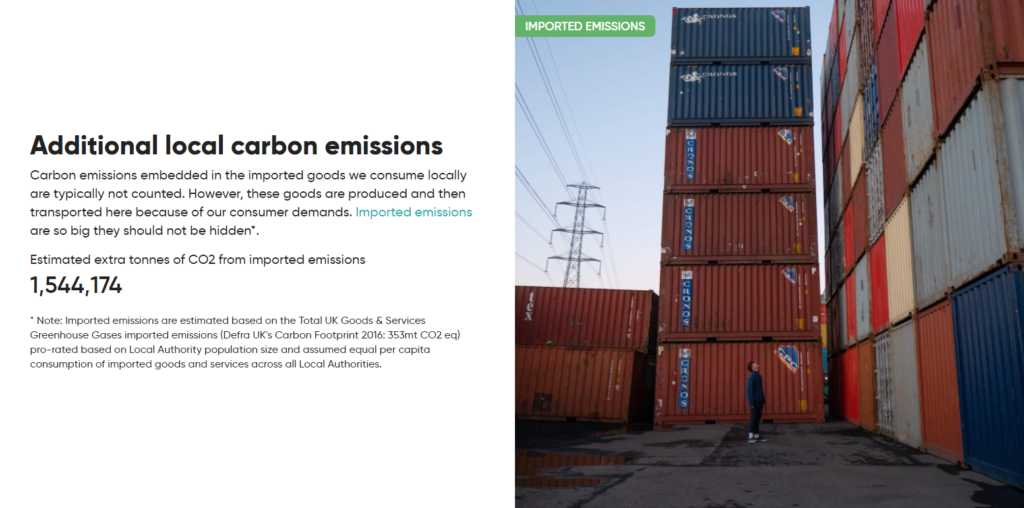
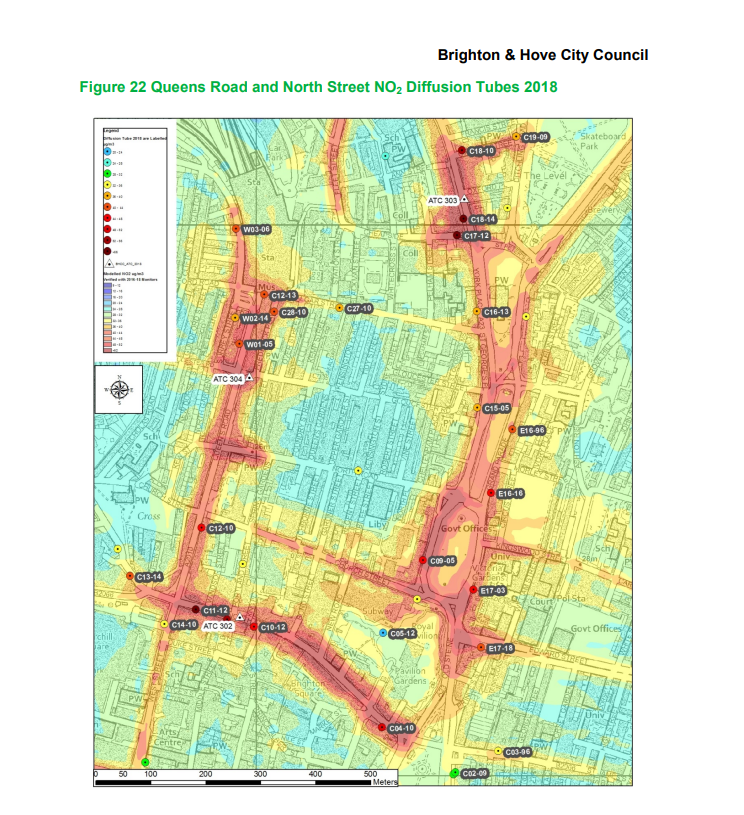
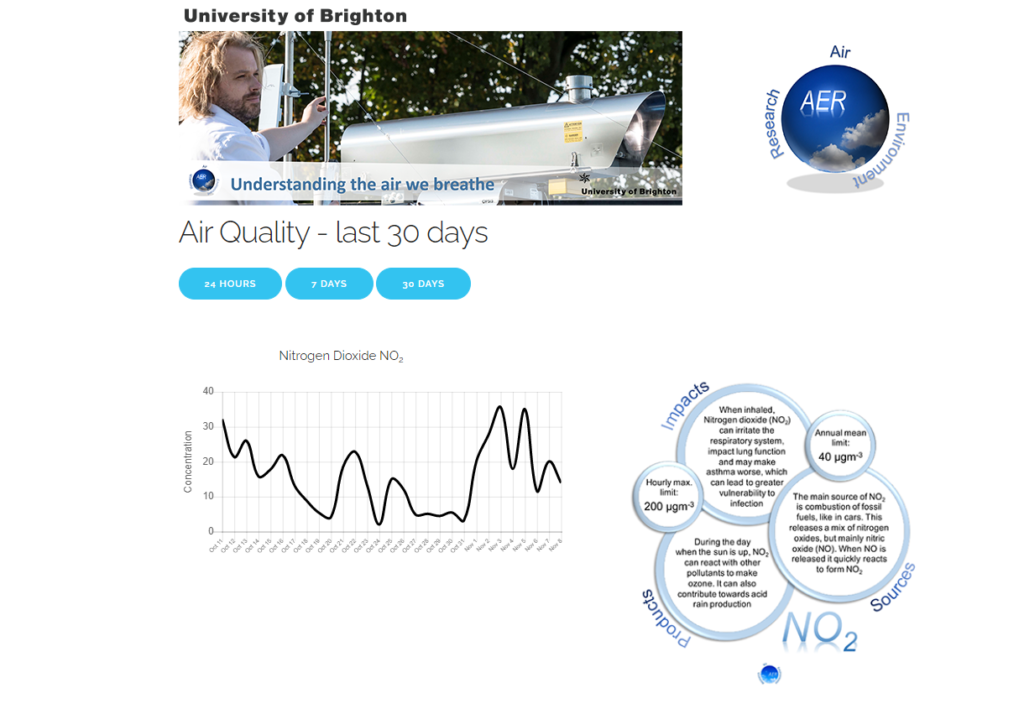
POLLUTION AND CARBON EMISSIONS
Here I have linked some screenshots of the research I used for my analysis sheet on this information:

POPULATION DENSITY AND AGE DEMOGRAPHICS
Some resources I used: